
October 7th, 2019
The Economy
social-issues
How much does the federal government spend on children? Take a look at our visualization to find out

October 2nd, 2019
The Economy
social-issues
Wealth
Which major economic events have had the greatest impact on the world’s GDP growth? Our newest visualization offers a few answers.

September 27th, 2019
business
What are the daily earnings of the most profitable companies on earth, and what’s next for these behemoths?

September 25th, 2019
The Economy
trade
How big of an impact does the services sector have on the world economy? Take a look at our visualizations to learn more.

September 24th, 2019
investments
Is investing in cannabis stock right for your portfolio? Here’s a look at how cannabis stock prices have changed over time

September 19th, 2019
The Economy
trade
A quarter of what the world produces is categorized as “industry.” Here’s how industry output varies from country to country.
September 17th, 2019
The Economy
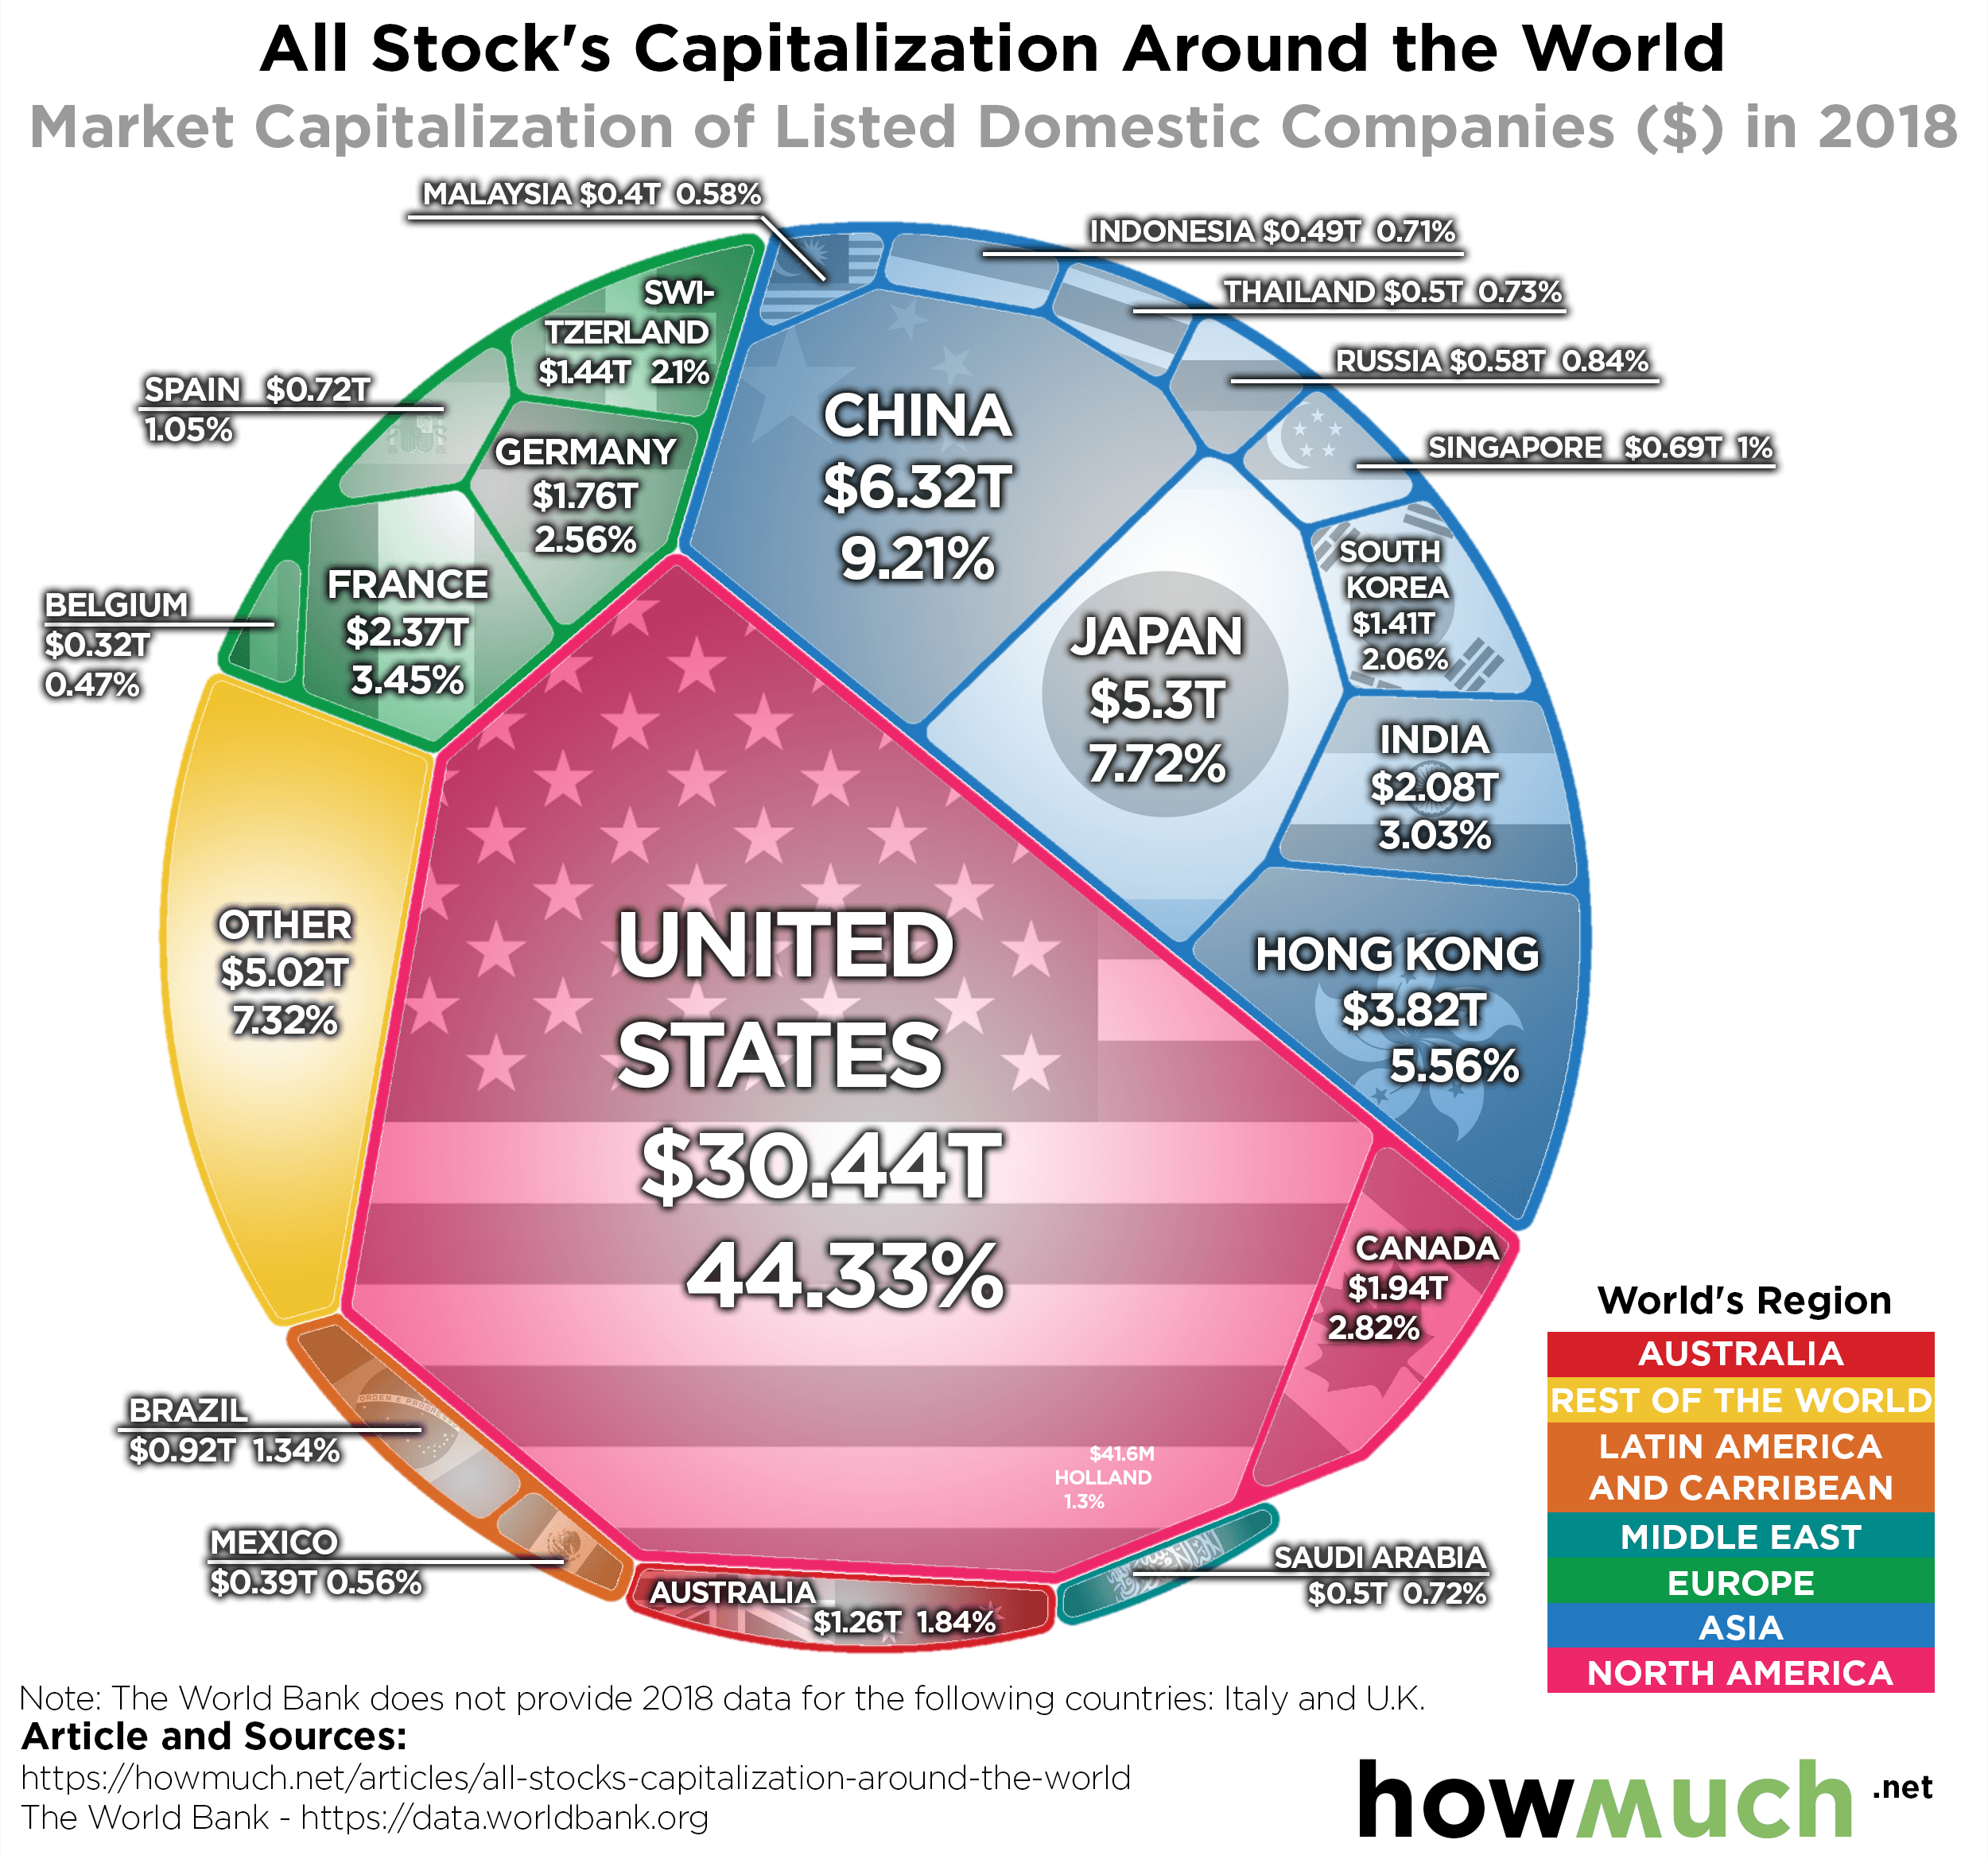
The U.S. dominates the global equity market with nearly 50% of global stock market value. But, do regional players stand a chance against this behemoth?

September 16th, 2019
The Economy
trade
The global plastic export market is in for some major changes. Here is a look at the major plastic exporting countries and how they are adapting.

September 16th, 2019
The Economy
Love to travel? See where most tourists are spending their vacation dollars.

March 6th, 2026
The Economy
As fears of a global economic slowdown loom, our new visualization looks at the breakdown of GDP around the world, as adjusted by purchasing power parity.