
February 19th, 2020
Personal Finance
Real Estate
social-issues
What are Americans paying in renters insurance, and will these numbers change with the housing boom?

February 17th, 2020
The Economy
trade
While the U.S. is categorized overall as a “net importer” of goods, these visualizations reveal that the balance of U.S. trade varies significantly from trading partner to trading partner

February 13th, 2020
The Economy
cryptocurrencies
monetary-policy
Bitcoin is back over $10,000, but how does its liquidity compare to other asset classes? Our visualization puts things in perspective.

February 12th, 2020
Personal Finance
business
Check out this map for a unique snapshot of the market for motorcycle insurance and its popularity across the country.

March 20th, 2026
Personal Finance
taxes
social-issues
Ever wondered how your state’s tax system compares to others? Here’s an overview of the U.S. state tax system based on seven visualizations.
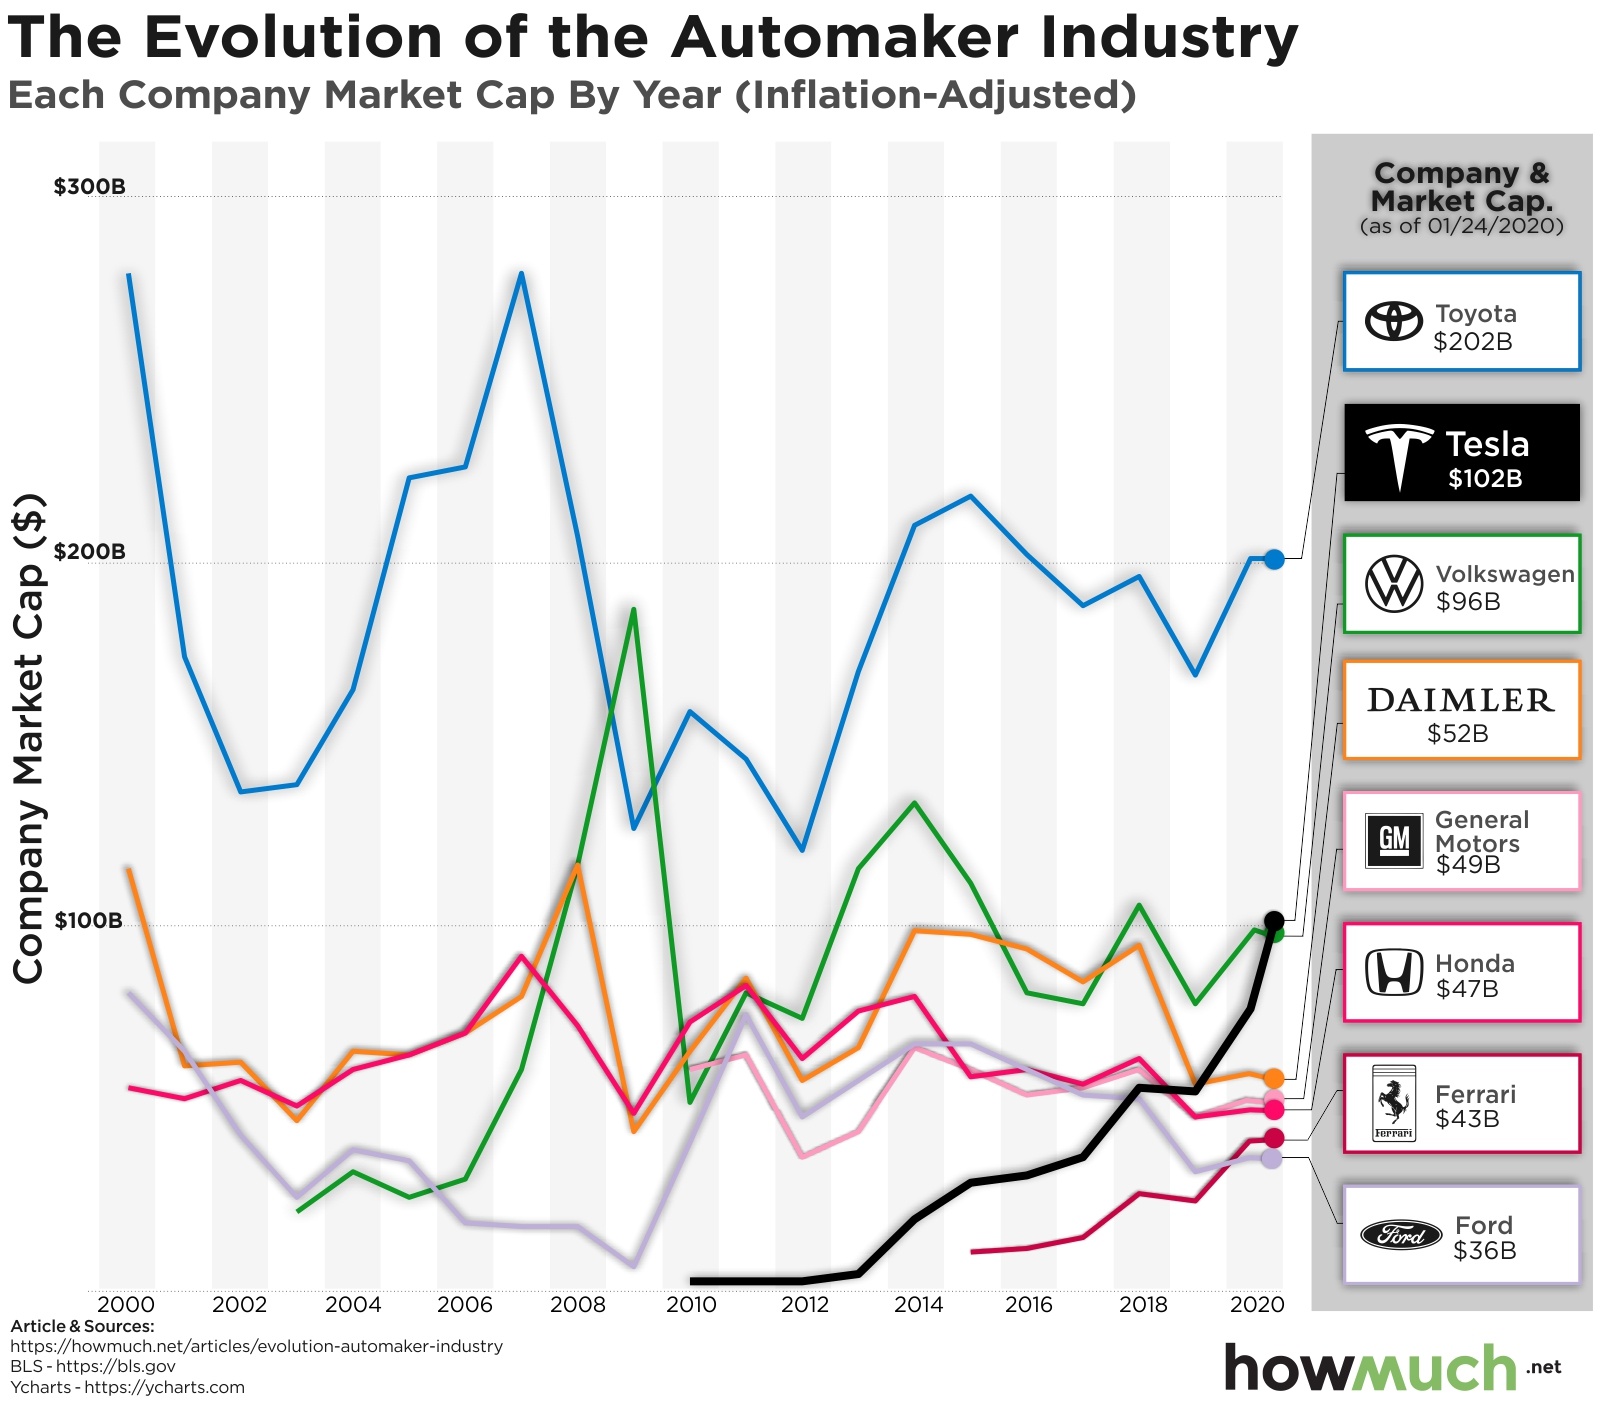
February 4th, 2020
business
investments
trade
How does Tesla’s recent growth compare with other automakers in the U.S. and abroad?

February 3rd, 2020
business
The Economy
investments
jobs
Public companies aren’t the only businesses to have an outsized effect on the U.S. economy. These private companies also command high revenues, as well as high employment.
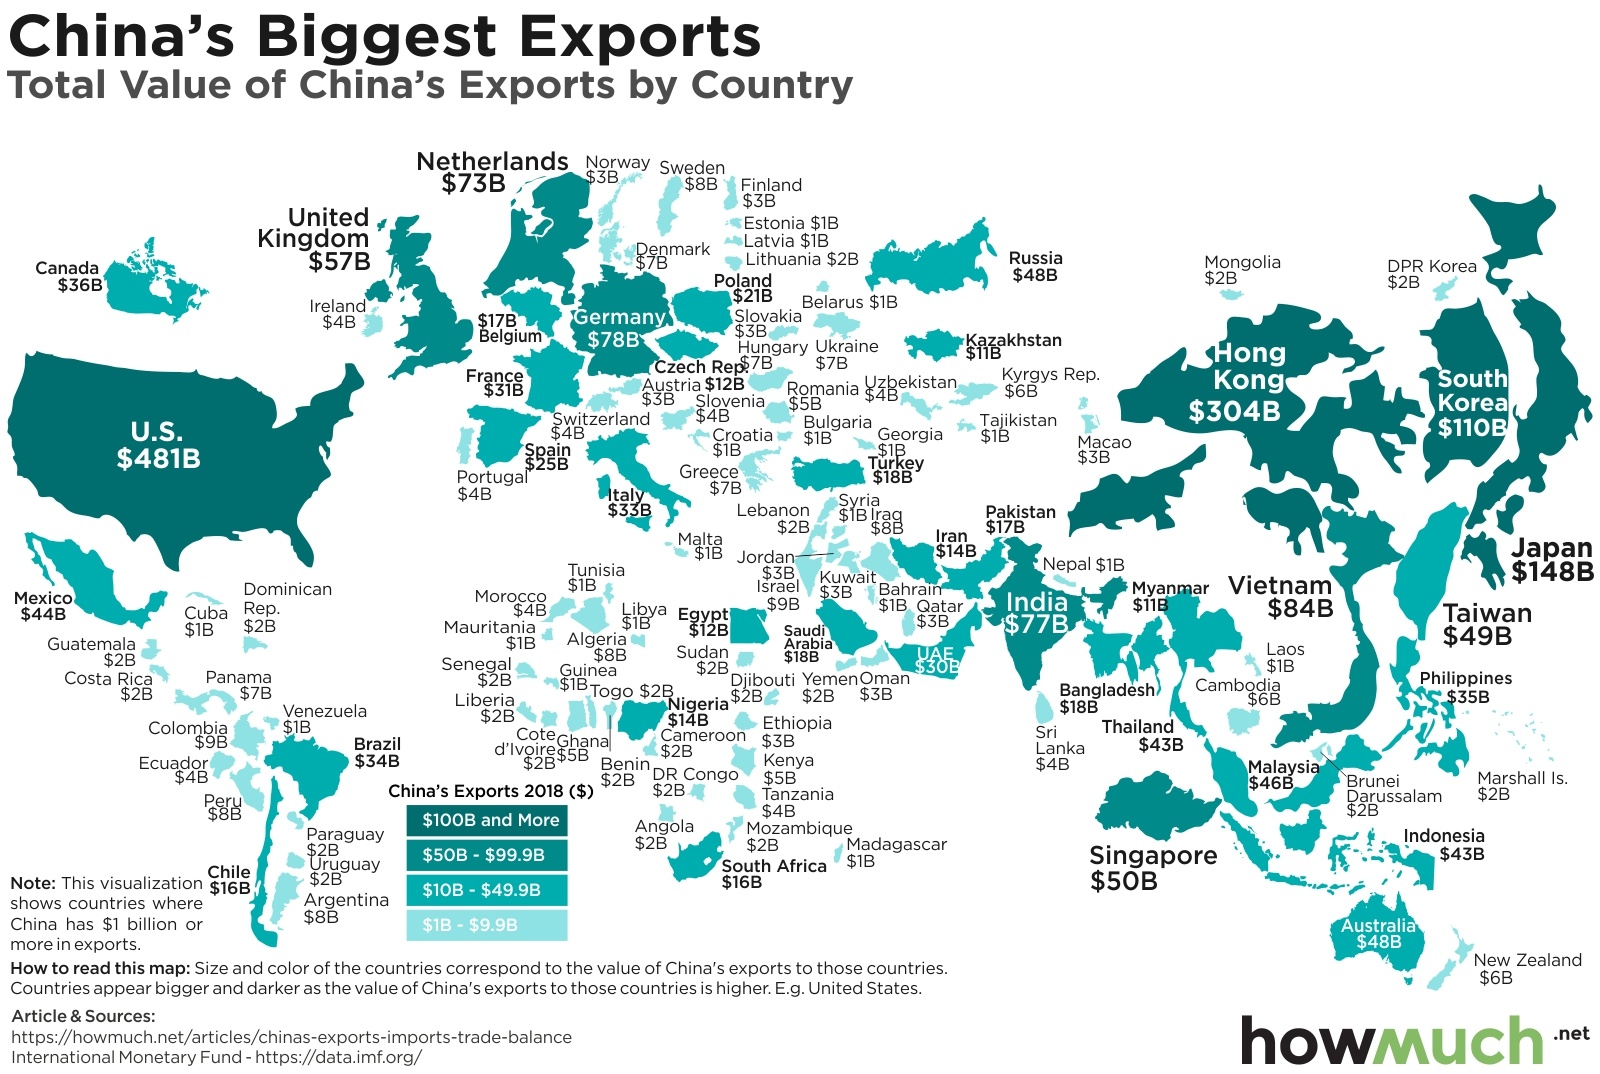
March 6th, 2026
trade
As Phase I of the U.S.-China trade deal goes into effect, our new series of visualizations take a closer look at China’s role in global trade

January 27th, 2020
The Economy
investments
trade
monetary-policy
How do the U.S. and China compare when it comes to world trading partners from 1980 until the present? Take a look at our helpful visualization to learn more.

January 23rd, 2020
business
The Economy
Wealth
The “Trillion Dollar Club” just welcomed its newest member. Here’s the full list of U.S. companies with the unique distinction of being worth more than $1 trillion.