January 21st, 2020
Personal Finance
debt
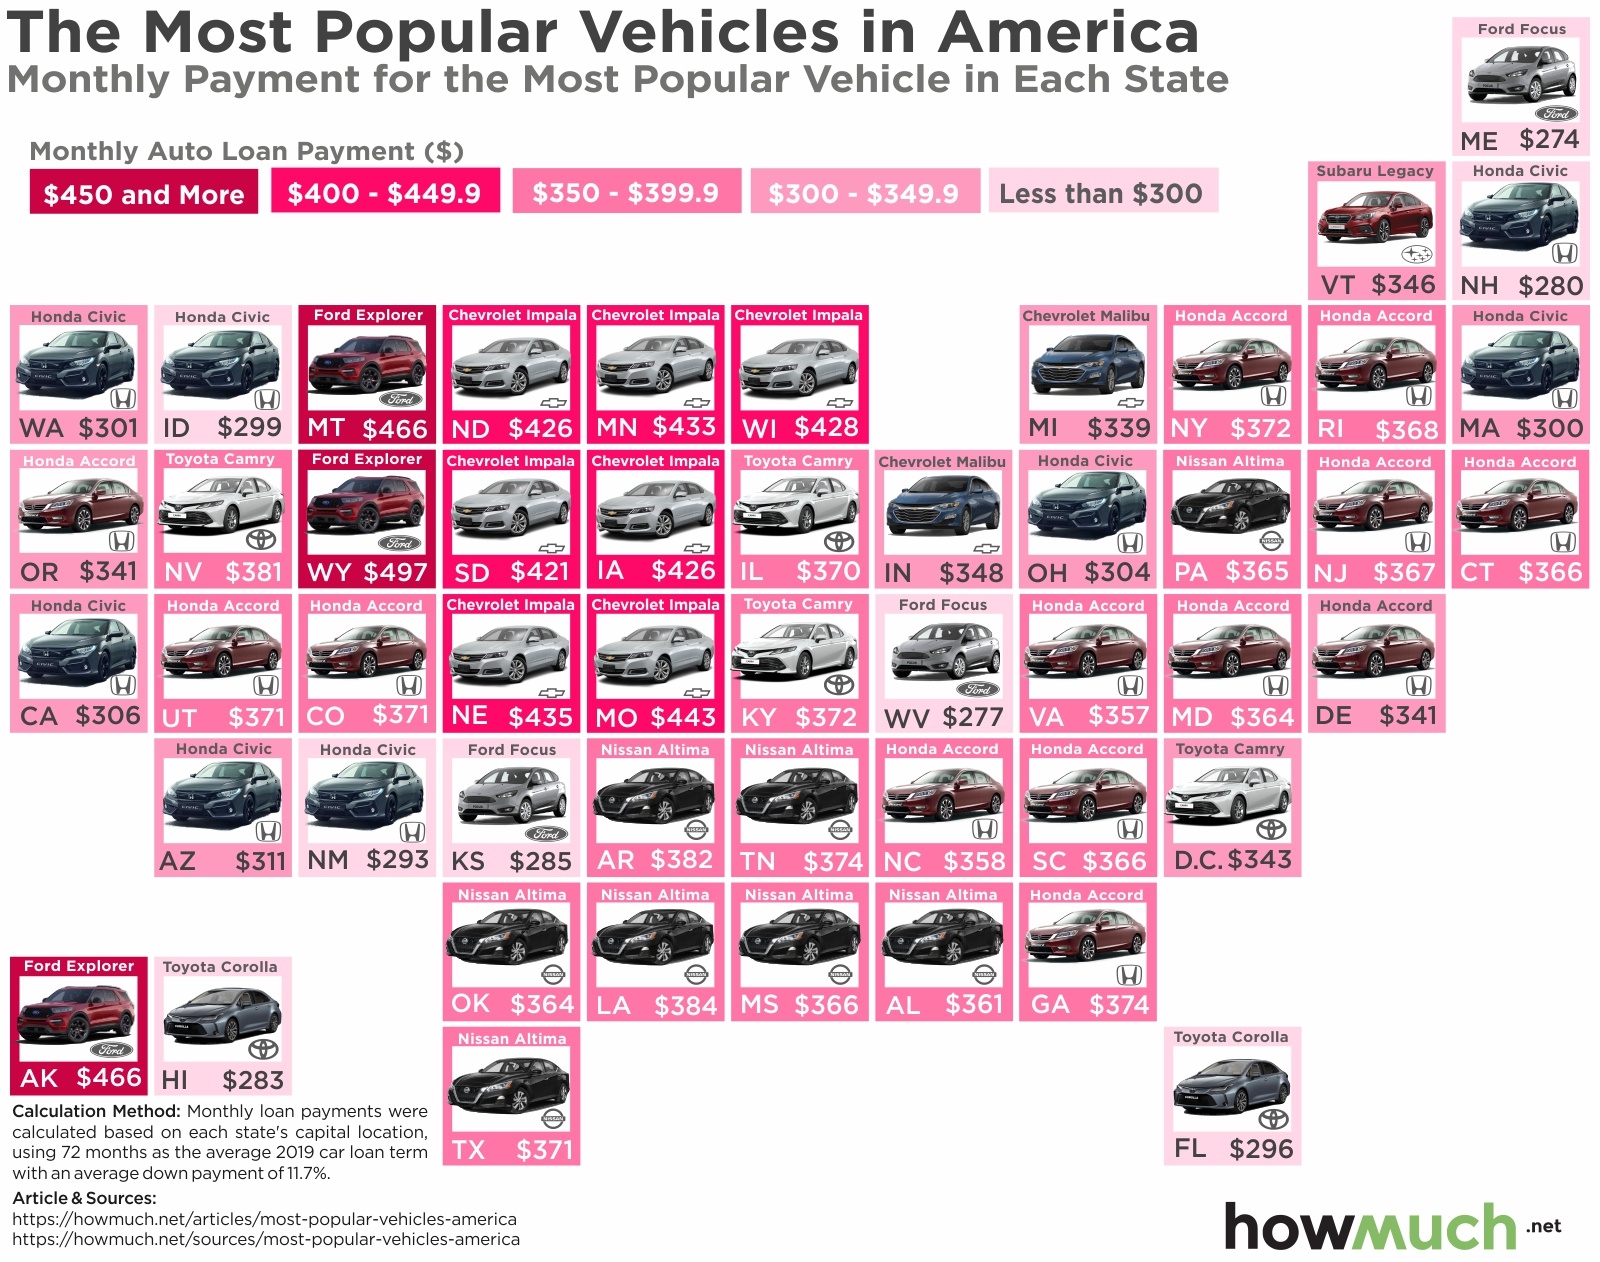
What is the most popular vehicle choice in each state, and what does this say about the auto market?

January 21st, 2020
The Economy
social-issues
trade
With the U.S. and Iran hitting the newswire, how do the two stack up economically, militarily, and population-wise? Our visualization highlights key metrics to show the size of the two countries side by side
January 16th, 2020
business
The Economy
social-issues
Wealth
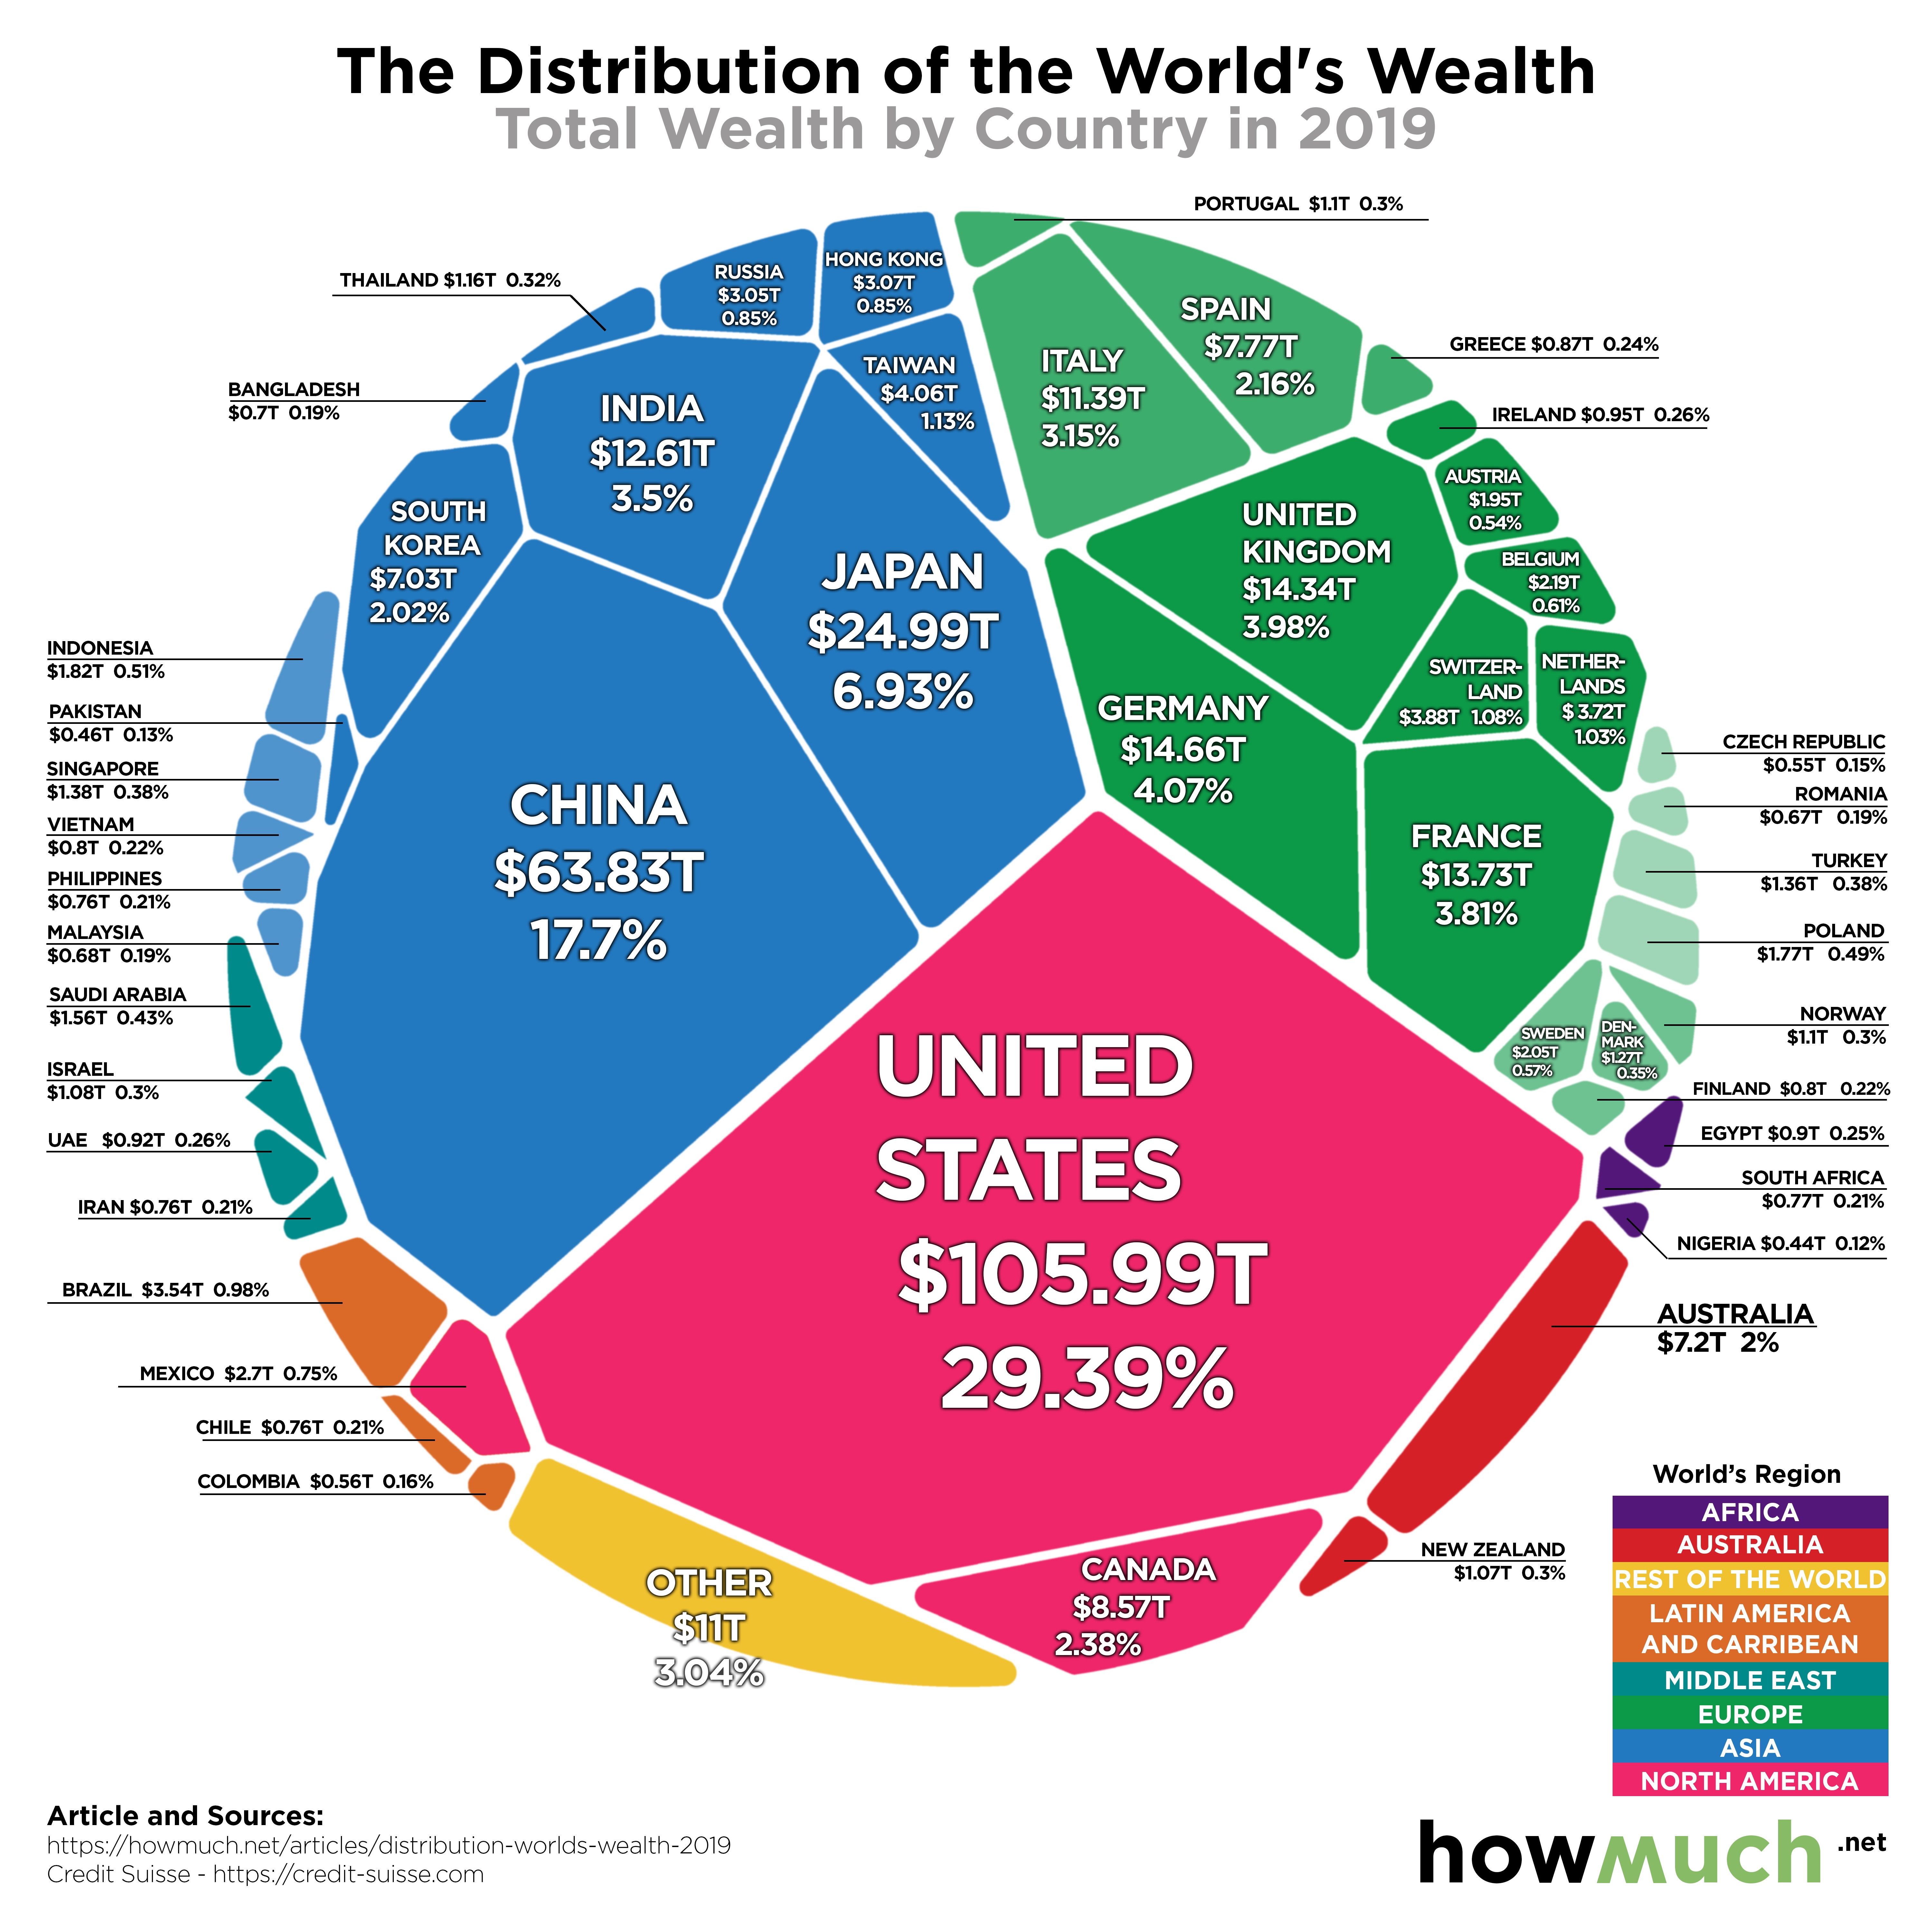
The world has a net worth of $360T. The U.S. economy continues to dominate given its sheer size, Asia and Europe are not that far behind.

January 14th, 2020
Personal Finance
The Economy
social-issues
monetary-policy
Electric cars are good for the environment, but they can be bad for your budget. This map breaks down how much it costs and how popular it is to own an electric vehicle.

January 13th, 2020
Personal Finance
business
Wealth
Where do the world’s wealthiest families come from, and how did they make their fortunes?
January 9th, 2020
The Economy
social-issues
monetary-policy
Wealth
jobs
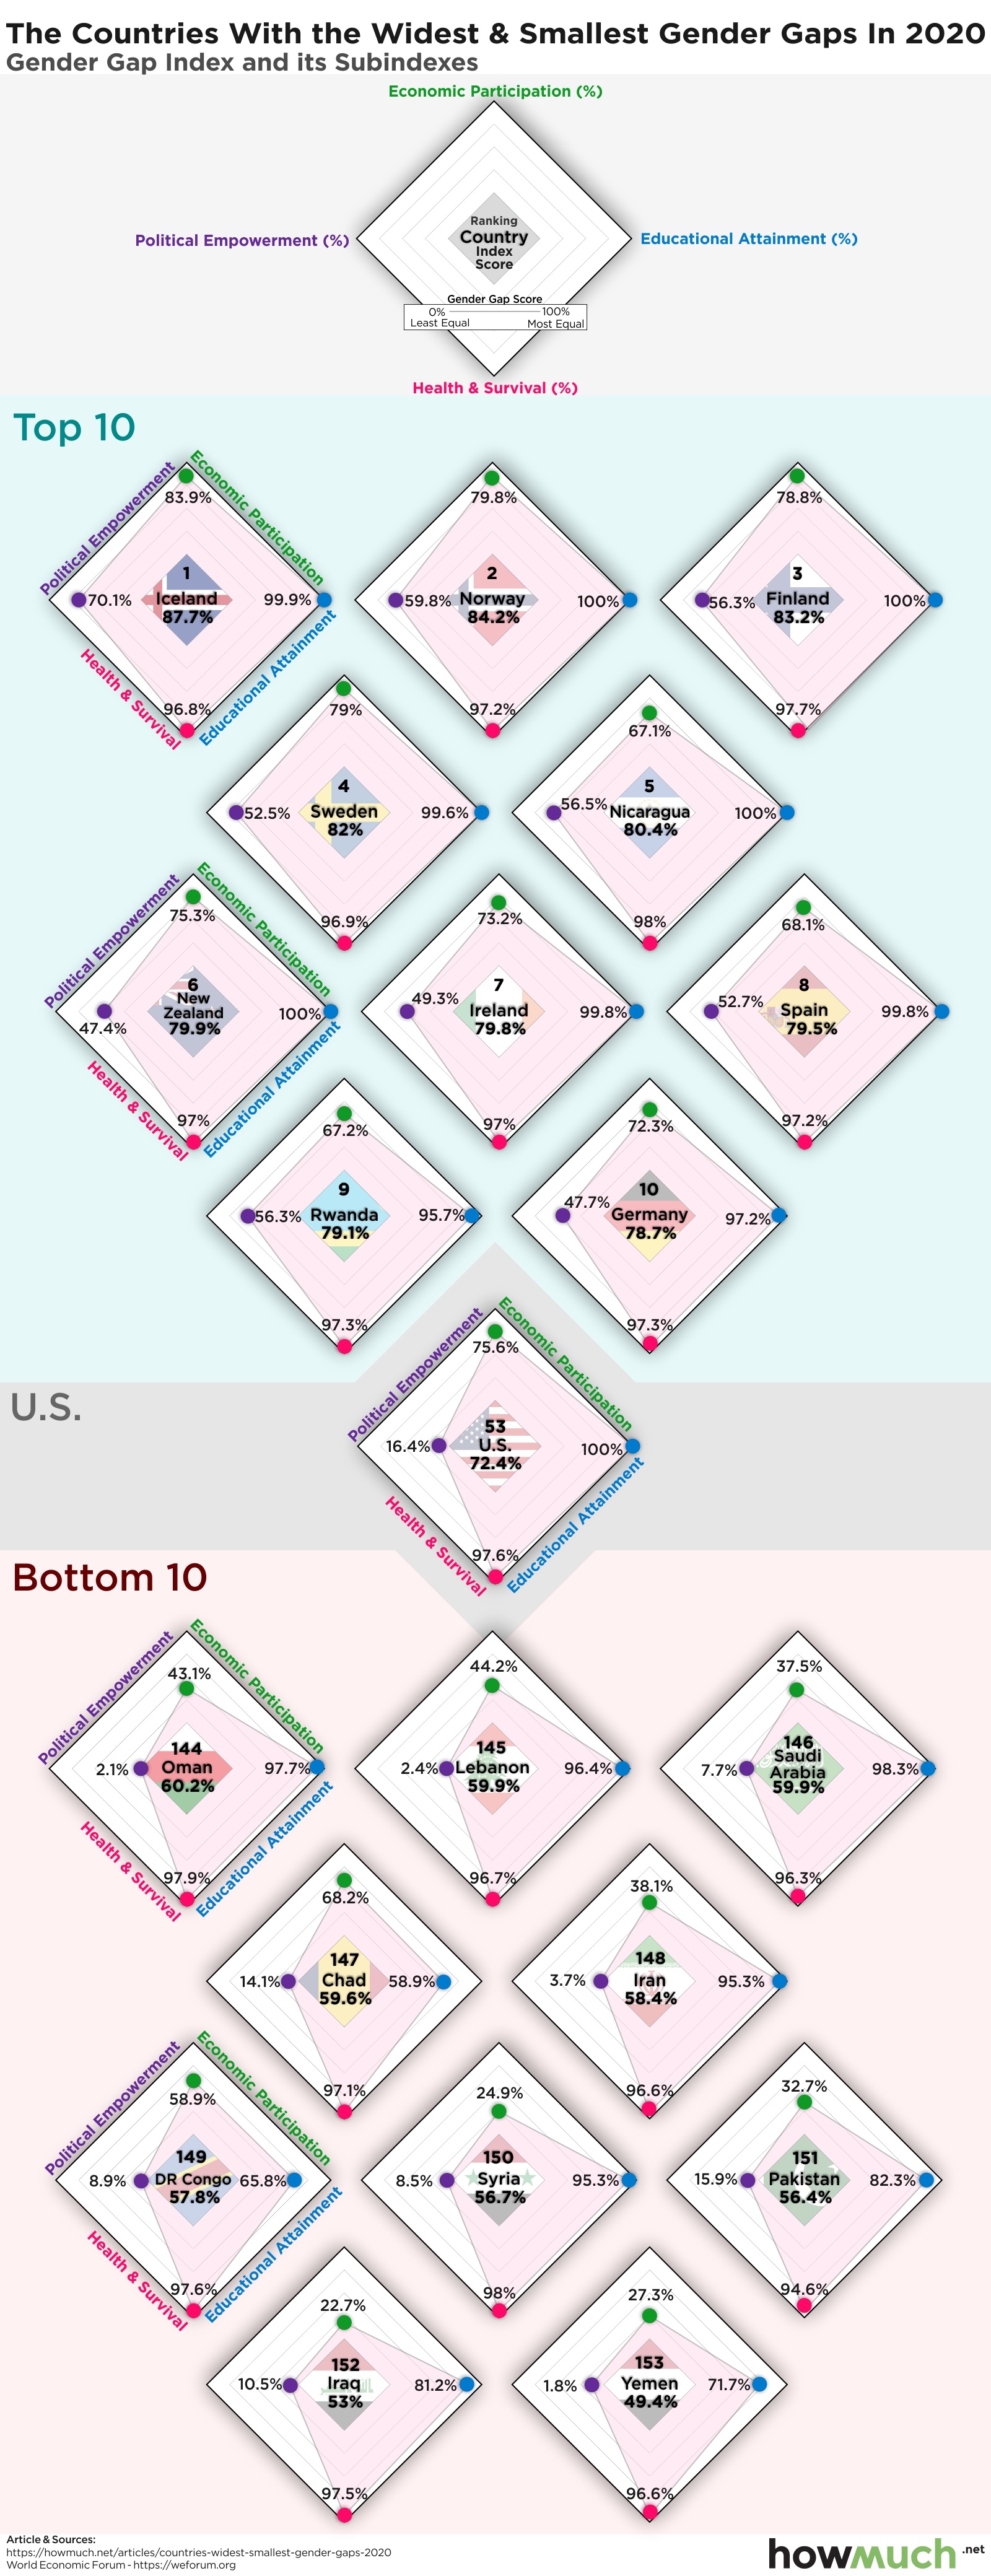
Which countries around the world lead the way in closing the gender gap and are they achieving their goals on all fronts? Our visualization lays out all the key elements for the top scorers.

January 8th, 2020
Personal Finance
business
Wealth
These billionaires experienced some major changes in their bank accounts in 2019
January 7th, 2020
Personal Finance
business
social-issues
Wealth
jobs
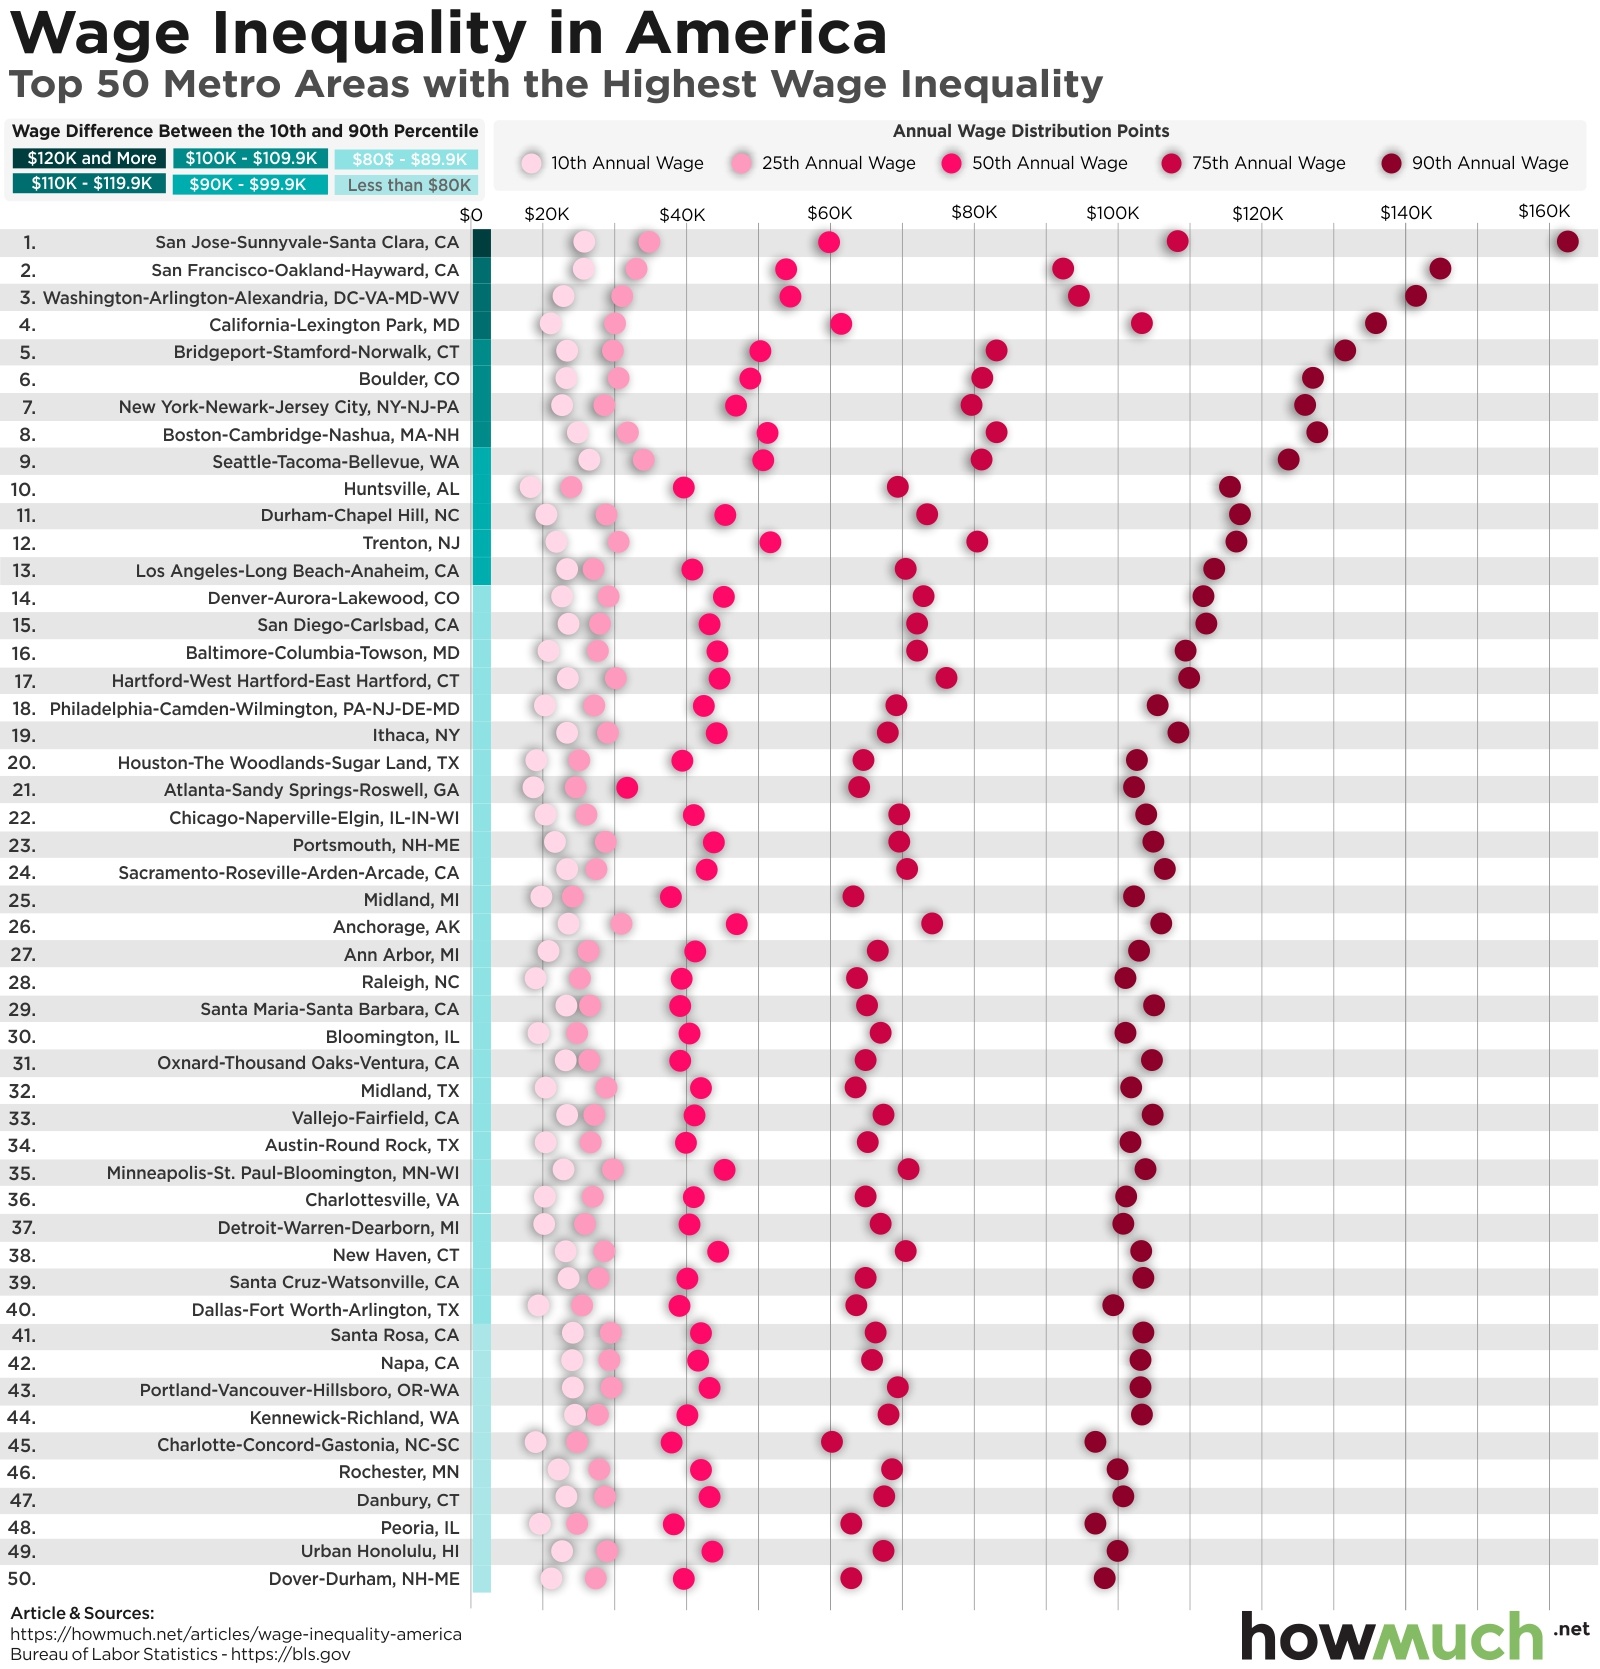
Income inequality is at an all-time high in America. This visualization breaks down the cities with the biggest gaps between high- and low-wage workers.

January 2nd, 2020
The Economy
This visual highlights the main events impacting the growth of GDP in the U.S. economy over the last 90 years

December 30th, 2019
Personal Finance
business
The Economy
social-issues
Wealth
What areas would you expect to drive U.S. economic output? Do more people equal more firepower, or does the location matter? Check out our county-level visualization to find out.